
To most outsiders, the world of energy efficiency probably appears static with slow, incremental changes. A furnace rebate here, light bulb swap-out there, maybe an updated building energy code every few years. But it should come as no surprise to industry insiders that this isn’t the case at all. An explosion of new technology across every part of our economy is rapidly changing our energy savings goals and the ways we identify and capture those savings.
Together, these changes build to "tipping points" - the point at which a series of small changes or incidents becomes significant enough to cause a larger, more important change.
In this new blog series, we'll examine increasingly important trends that shape how we approach energy efficiency programs. In some areas of the Midwest, program administrators are already responding to these tipping points with new pilots and updated program designs. Other areas may be getting passed by, leaving valuable and cost-effective energy savings on the table.
EE Tipping Point #1: Heating and Cooling Falls Below Half of U.S. Residential Energy Use
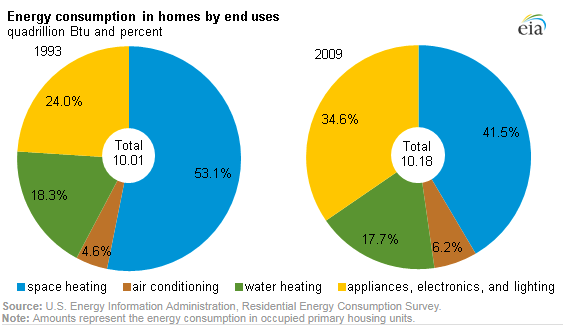
For as long as residential energy use has been studied, space conditioning (heating and cooling) has always accounted for the majority of residential energy consumption. Accordingly, air conditioners, furnaces, boilers and other energy hogs have always been prime targets for efficiency efforts. For decades, we’ve chipped away at this blue chunk of the pie chart with equipment standards, labeling programs, new equipment incentives, insulation, air sealing and lately, whole-home performance retrofit strategies. (Interestingly, EIA also attributes a small amount of the proportion changes to “population shifts to warmer climates.”)
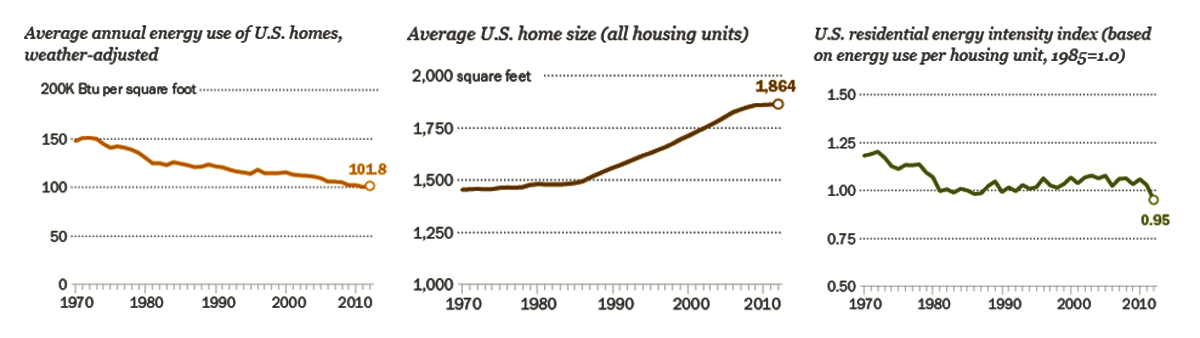
The good news is that these efforts have undeniably worked. According to the Pew Research Center, since 1970, per home average energy use has decreased 31% even while average home square footage increased 28%. Likewise, the number of homes rose 80% over the same time period, but only consumed 45% more energy.
The bad news is that while all this progress was occurring, another slice of the pie was quickly expanding. The appliances, electronics and lighting category grew from 24% in 1993 to 35% a decade and a half later, and more recent data show these devices are now collectively rivaling space heating for the heavyweight title. Given recent improvements in lighting efficiency and ongoing efforts with large appliance/white goods energy standards, much of the issue resides in the increasing quantity of appliances and electronics that now pervade the American home experience. The average quantity of appliances and electronics in US homes has grown substantially over the last decade, and estimates for the number of connected devices and their electric components in 2020 now exceed 50 billion. And the fact that these devices are almost entirely powered by electricity matters. As the U.S. Energy Information Agency notes, “increased electricity use has a disproportionate effect on the amount of total primary energy required to support site-level energy use.”
It’s clear that as technology and society change and efficiency efforts bend curves, our aim needs to shift with our targets. Perhaps it’s past time to shift our program efforts toward this new half of the pie. Part of this will involve reinventing the same kinds of energy use standards that have been so successful to date. Similarly, there is likely a need for targeted incentives to help drive consumer behavior toward the most efficient devices. And of course, part of the solution may reside in harnessing some of the more advanced connected products to facilitate reducing energy use automatically or intelligently.