The Georgetown University Energy Prize (GUEP), currently in its second round, includes a total of 50 cities and counties competing to “change the way America uses energy.” Each city or county has already developed a long-term energy efficiency plan. Now they are implementing their plan’s initial effectiveness/sustainability over a two-year period. The competition provides a unique platform bringing together residents, government leaders and utilities into competing communities – united in the goal of improving their energy efficiency.
Each community entered into the competition is required to report quarterly results, and entrants will need to balance CO2e and financial savings in order to win the $5,000,000 prize.
Scores are posted on the public dashboard and are based on the Georgetown University Energy Prize’s “Overall Energy Score,” (OES) which calculates each community’s reduction in overall energy use, combined with a set of other factors. Recently, the data from second quarter of 2015 was posted.
Summary of the Current Data
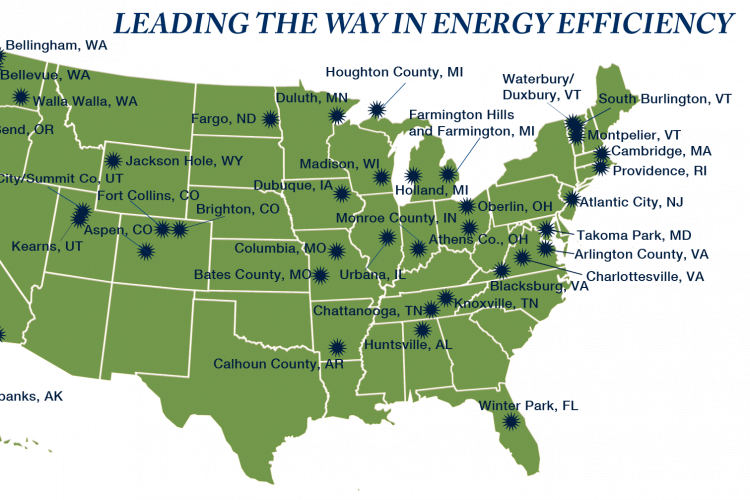
The top 20 energy savers from Q1 and Q2 include four Midwest cities!
- Leading the Midwest is Holland, MI which ranks nationally at #4 with an overall energy score of -20 (negative equates to savings). As you might expect with a #4 ranking, Holland has received some publicity.
- Right behind Holland is Fargo, ND which is ranked #5 with an overall energy Score of -14
- Columbia, MO is currently tied with Dubuque, IA – both with an Overall Energy Score of -8
Urbana, IL and Oberlin, OH complete the governmental organizations which have reduced their overall score of city wide energy use (reporting scores of -2 and -1 respectively). Other Midwest jurisdictions that have entered the competition include: Madison, WI; Duluth, MN; Houghton County, MI; Farmington Hills and Farmington, MI; Athens County, OH; Monroe County, IN; and Bates County, MO.
Statistical Considerations
As with typical building energy benchmarking tools, the OES adjusts for population, weather, as well as the energy used in producing and distributing the energy. The dashboard presents the aggregated electric and natural gas energy consumption for each entity. GUEP notes that the initial results naturally hold certain seasonal advantages and disadvantages for communities in different parts of country, given the current data includes only January through June of 2015. When comparing energy consumption across the country, these seasonal variations will ultimately even-out (this is called weather normalizing).
The full competition lasts 48 months to include 24 months of baseline data and 24 months of measured competition data. Check back in the spring of 2016 for the adjusted numbers.
Congratulations to all the participating cities and counties!